And now for my annual reminders:
The more things change,
the more they stay the same.
And
All Real Estate is LOCAL.
(National and Bay Area-wide trends may not be what is happening in your neighborhood.)
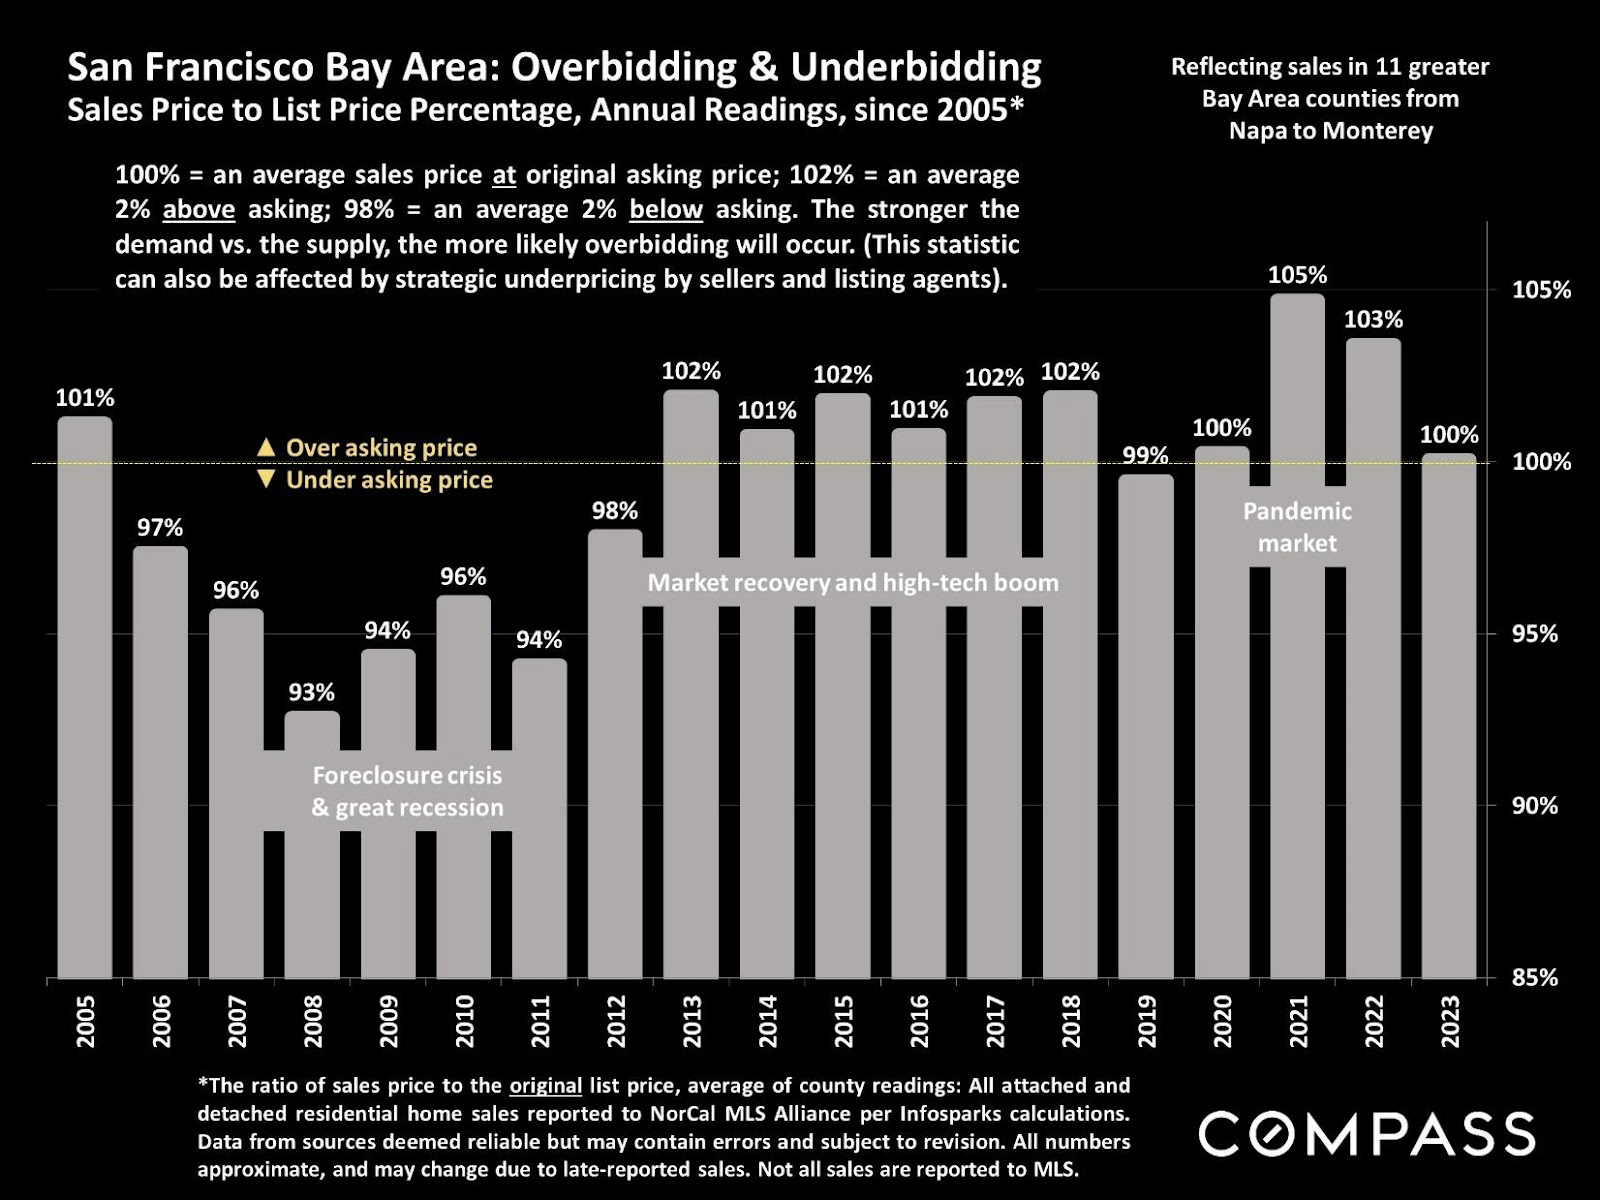
1. Overbidding is Alive and Well
Sixty-five percent of property sold in Alameda County in 2023 sold over the asking price, continuing the long-term trend, even though overbidding in the Bay Area as a whole was less pronounced than in hotter market years.
Overbidding in the Inner East Bay arises out of local customs to set prices lower than actual market value, a practice seemingly rooted in the expectation that the suppy-demand imbalance regularly leads to multiple bids, each outpacing the other until a final sales price is reached. The overall Inner East Bay average came to 108% last year, and represents a range of overbids from 130-150% for prime properties in sought-after neighborhoods such as Central Berkeley, to sales at and under the asking price, usually on property with conditions that failed to attract multiple bids, in less competitive areas, or on condos and multi-family properties, which tend to trade closer to their asking prices.
Alameda County:
65% of Homes Sold Over Asking

Inner East Bay:
Average Overbid 108%

Overbidding in the Inner East Bay, unlike some other parts of the Bay, remains entrenched, with 65% of homes in Alameda County selling over the asking price (likely more in Berkeley), and homes selling at an average of 108% over asking (with some as high as 130-150%)
SF Bay Area:
Overbidding has flattened out
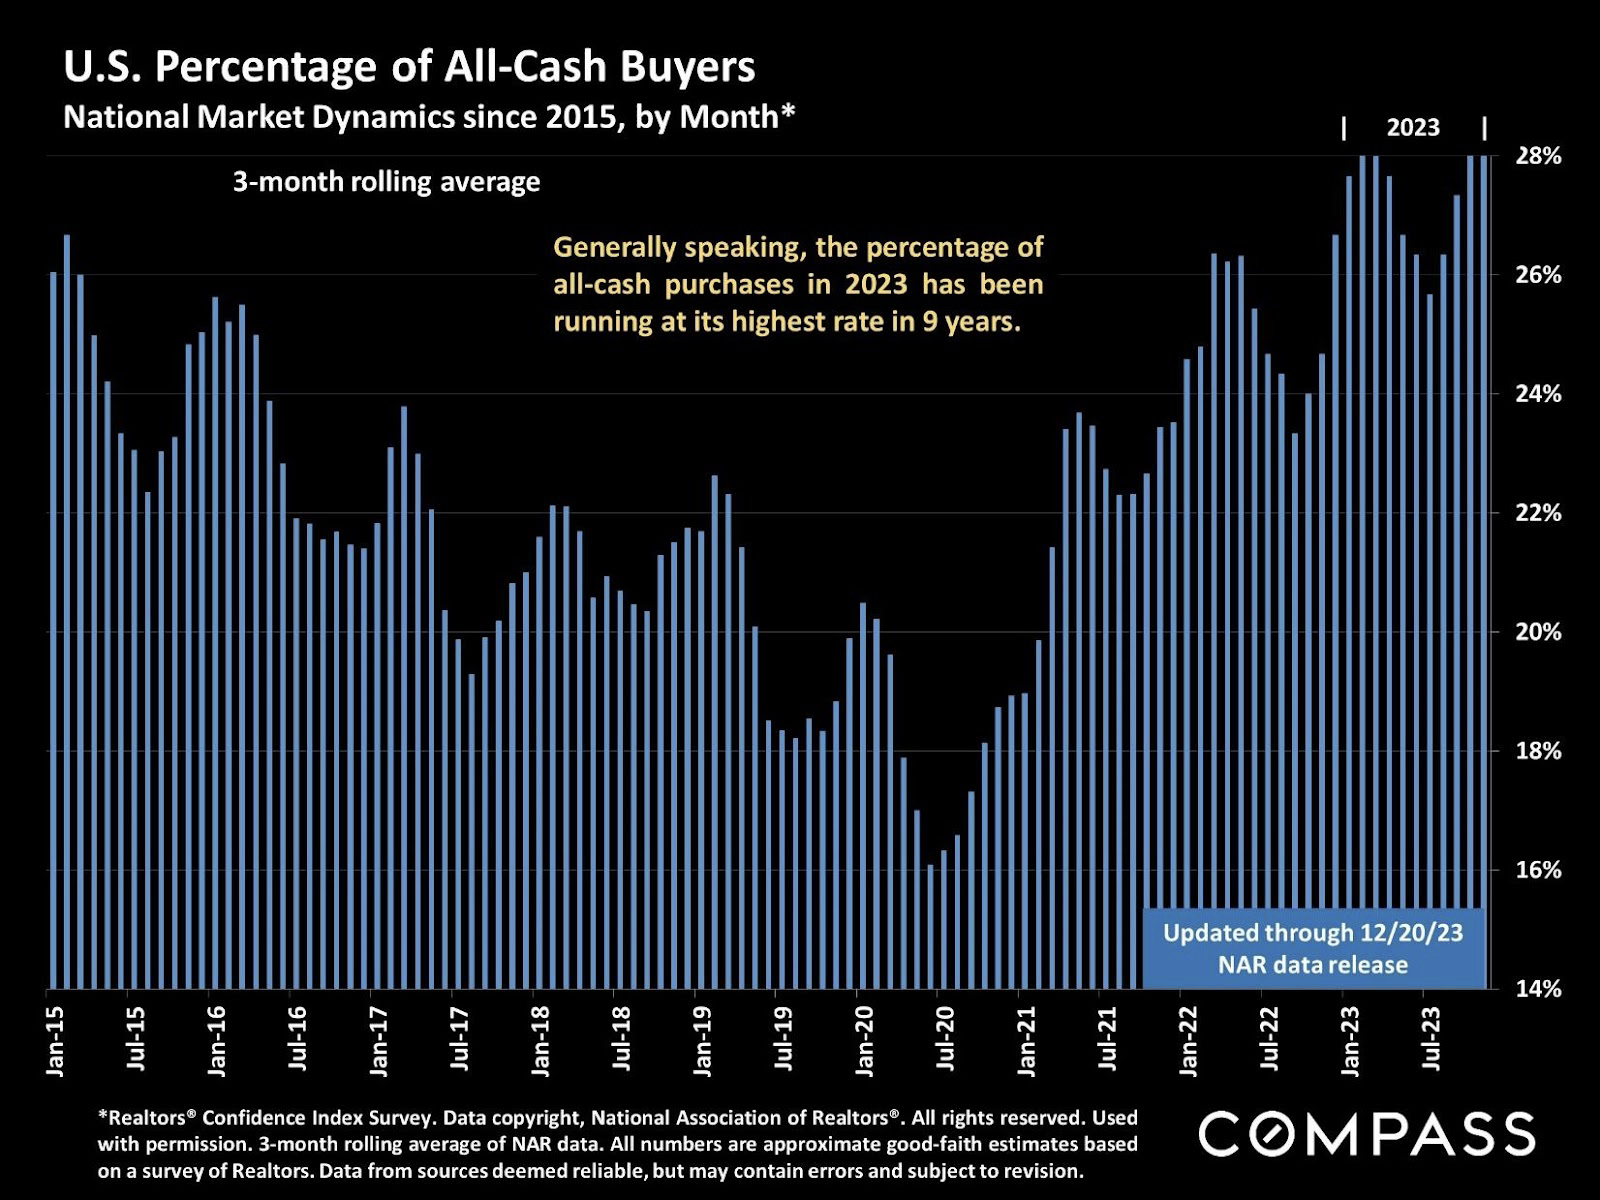
2. Cash Remains King – Now more than Ever
We are seeing more “all-cash” deals than ever! The share of all-cash sales is at its highest rate in 9 years nationally, as some buyers who can use cash are more willing to do so rather than face recent mortgage rates, and some employ a strategy to “win” bids against competing buyers whose purchasing power has been tamed by higher interest rates.
3. "Activity” can be different than “Action.”
Redfin has released statistics showing that there is 10% more buyer activity already this year – more buyers coming into the market, asking for information and help from agents, going to see or asking for appointments to see homes. BUT, at the same time, the MBA reports that applications for mortgages remain DOWN 12% year-over-year. So, people may be “looking” but may not yet be “ready and willing to buy.” This is common early in the year, and may improve. But it also mirrors something Realtors have noticed in buyers’ behavior as prices and interest rates have both held high:
We used to be able to correlate the amount of traffic at a listing and the number of people reviewing disclosures packages with the number of offers a listing receives, and how high the price goes. Over the past two years … not so much. Buyers still seem to look, but they have grown much more sensitive to issues they perceive as “risky” (such as earthquake and fire risk) or issues they expect may cost them money outside of the purchase itself (what they learn about condition, need for repairs, and issues affecting the cost of insurance.) So, a lot of people looking at a house or its disclosures is not always a clear indication that the house will sell quickly and for as high a price as it might have before the market peak in 2022. In related behavior, many homes are taking a little more time to sell, with the average Days on Market (DOM) ticking up to 22 from 14-to-18 days, for instance, in Berkeley and Kensington.

4. Pinpointing Price can be tricky
Nationally, the average price of a home in the US is up 4.4% in 2023 over the year before, according to the NAR. Price is typically propped up by the limited supply of homes for sale is outpaced by demand from buyers. And yet, when you slice and dice Bay Area and Berkeley-Oakland market data over the past year, two trends emerge. One -- we’re seeing slight declines in median prices overall, with prices mostly holding onto most of their pandemic-era gains. Two – The East Bay is not mirroring San Francisco or the Bay Area as a whole.
There are significant differences, neighborhood by neighborhood, in how much Inner East Bay prices have changed, making it hard to generalize one specific price trend. “Where” in the market you are matters a lot.
Across the Inner East Bay, we’re hearing the word “stabilized,” as prices have come “off” the spring-2022 peak price, but mostly held onto pandemic-era value increases. Differences in value vary neighborhood by neighborhood, with some high-demand neighborhoods at both higher-price points and “entry-level” neighborhoods retaining a top-2 or top-three year-ever pricepoint. Areas where prices have held firm are counter-balanced by decreases in less competitive and/or more urban neighborhoods. For example:
-
The median price for Berkeley’s sought-after Thousand Oaks neighborhood barely budged off 2021 and 2022 highs, while the median for Berkeley Hills homes notched down slightly, below the market peak in spring of 2022, but neck-and-neck with then-record 2021 values, and still far above 2020 and pre-pandemic values.
-
Medians in Oakland’s tawny Rockridge and Lakeshore neighborhoods gave up much of their pandemic-era gains, ending up closer to pre-2020, pre-pandemic price levels.
-
Median prices in popular, often-more entry-level-priced Oakland neighborhoods including Temescal, Maxwell Park, Fruitvale and Oak Knoll had only modest declines, notching 2023 values they can still count among their best two or three years ever.
-
If you prefer tracking “average” values, see the differences in this overview of Berkeley-market averages over the past 10 years.

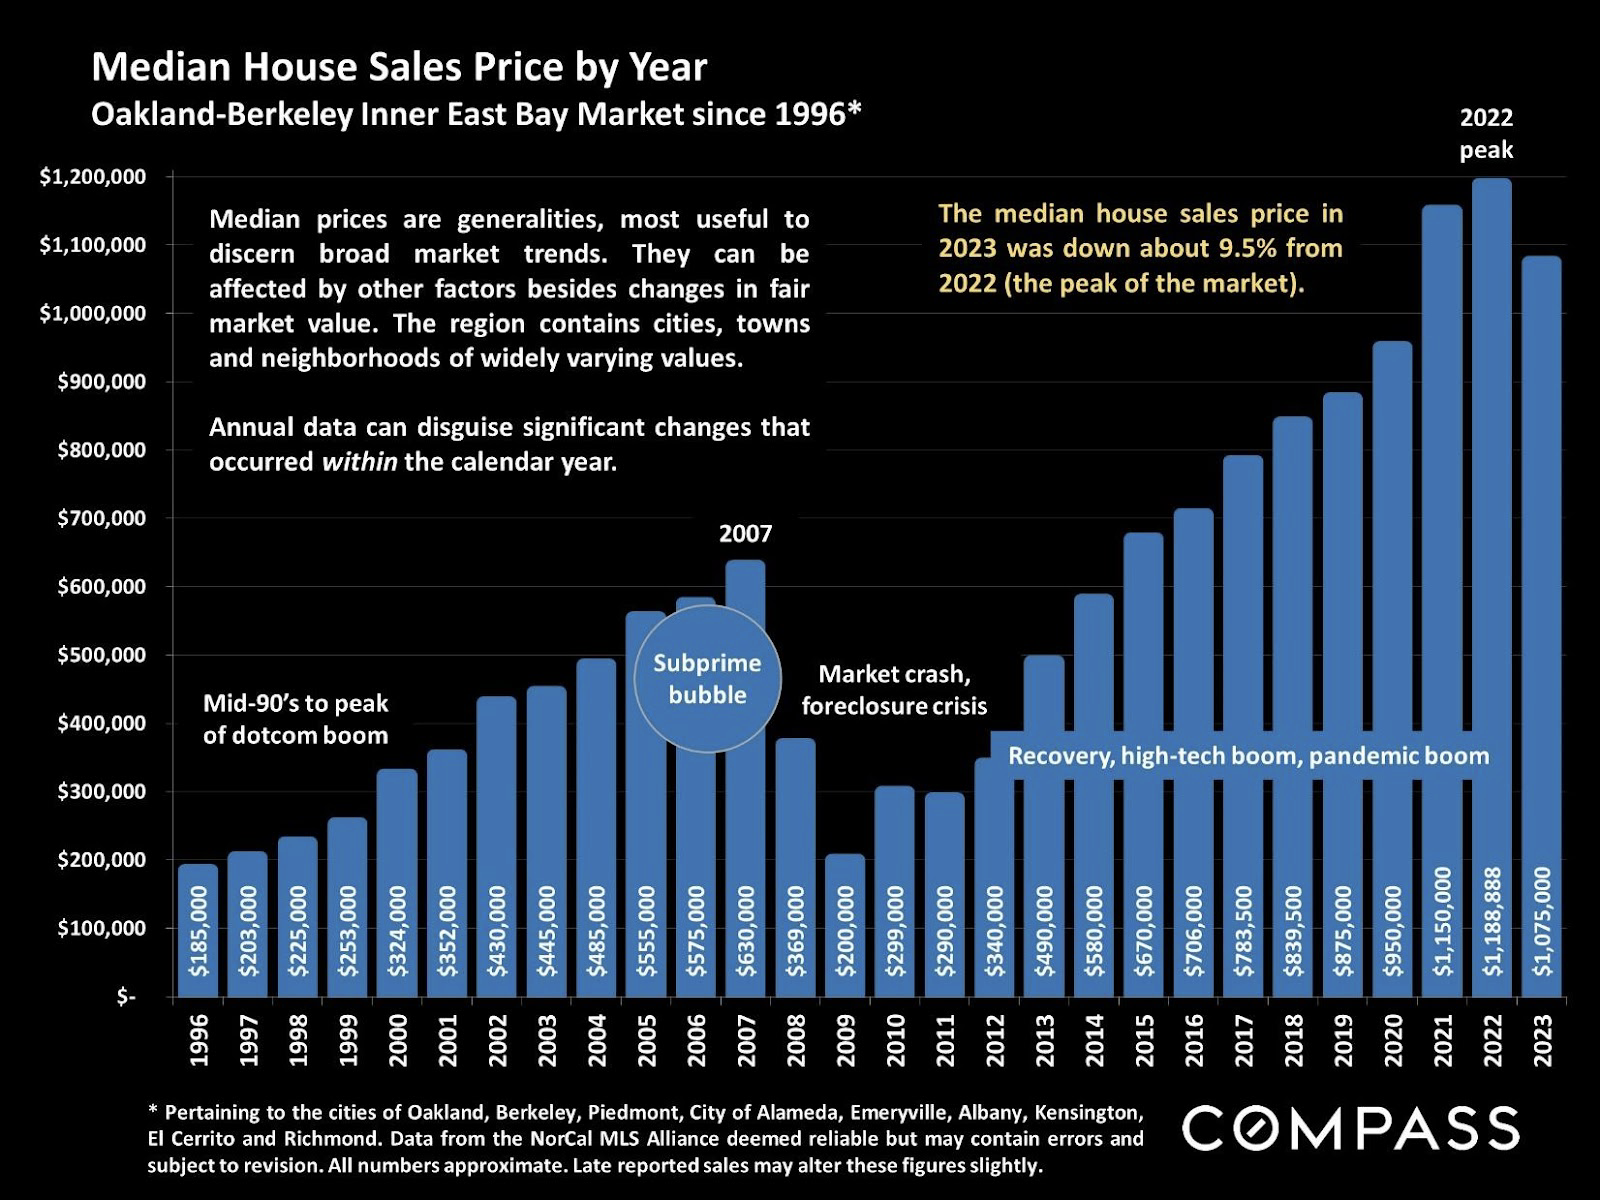
In general, declines in value have been less pronounced in the Inner East Bay than in San Francisco and the Bay Area overall, as prices on this side of the Bay remain more attainable for more people, keeping a steady influx of buyers seeking the most value for their dollar. “Median” home sale prices in 7 out of 9 Bay Area counties –including Alameda and Contra Costa County which include our Inner East Bay – all showed a decline in 2023 from 2022.
When figuring out what the price may be for a home you are either selling or buying, it’s more important than ever to understand which data you are relying upon (average and median do not mean the same thing), to understand the local-local market for that home, and to appreciate how the location and condition of a given property impacts its value.
Bay Area:
Median Prices By County

Inner East Bay:
Median Prices by Year
Be careful how you interpret what you hear. The Berkeley-Oakland market, a.k.a. the Inner East Bay, (which is included as the western-most parts of both Alameda and Contra Costa Counties) does not mirror “San Francisco” trends, and while it moves similarly to the Bay Area overall, it has distinct customs and patterns. Within the Inner East Bay, the market varies widely from neighborhood to neighborhood.
Inner East Bay:
Selected Neighborhood Median Prices

Share:
